Dynamic 3D Business Line Graph Animation
By 02labOne great value subscription from €14.50/month
- Unlimited downloads of 27+ million creative assets
- AI Tools: video, image and more
- Lifetime commercial license
- Easy cancellation
Attributes
- Length
- 0:10
- Resolution
- 1920 x 1080
- File Size
- 40 MB
- Frame Rate
- 25 fps
- Alpha Channel
- No
- Looped
- No
- Video Encoding
- Photo JPEG
- Orientation
- Horizontal
- Commercial License
- Further Information
Description
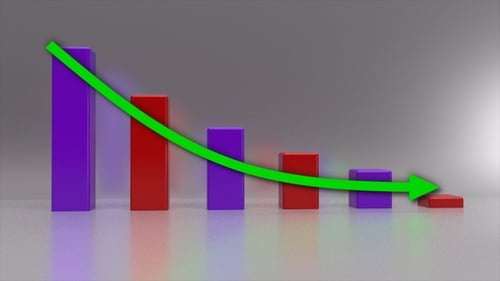
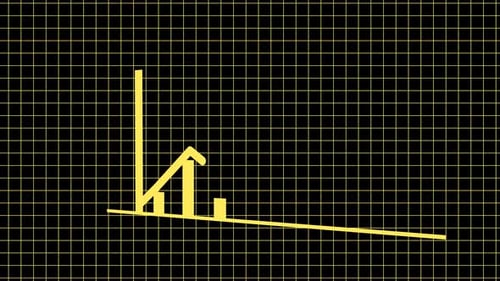
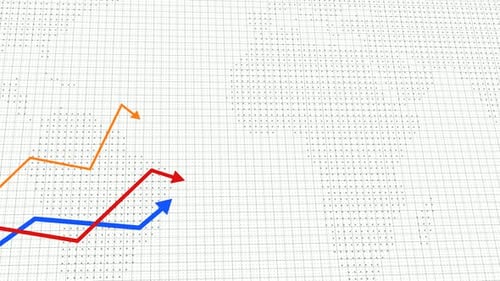
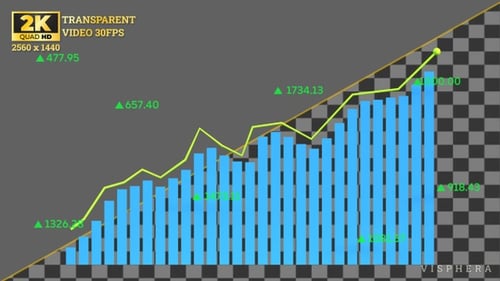
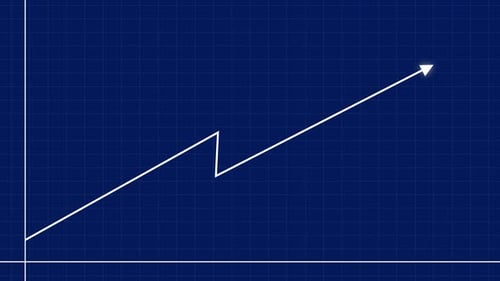
An animated 3D line graph dynamically visualizes data fluctuations and growth trends against a clean, white grid background. The vibrant yellow line, rendered with depth and subtle shadows, moves organically to represent upward and downward shifts, ultimately showing an overall positive progression. This professional and modern visual asset is ideal for enhancing corporate presentations, financial reports, economic analyses, or any project requiring a clear, engaging representation of quantitative performance. Its fluid motion and crisp design effectively convey business growth, market trends, or statistical changes with a sophisticated and clear aesthetic.