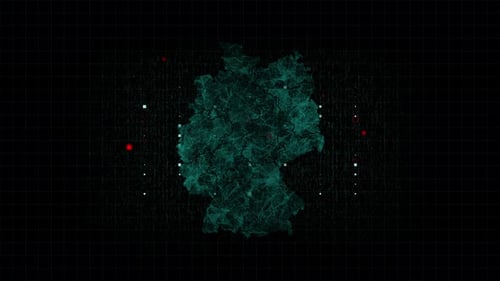
Mapping Epidemic Outbreak in Germany 4K
By rodionovaOne great value subscription from €14.50/month
- Unlimited downloads of 27+ million creative assets
- AI Tools: video, image and more
- Lifetime commercial license
- Easy cancellation
Already have an account? Sign in
Attributes
- Length
- 0:20
- Resolution
- 3840 x 2160
- File Size
- 2.08 GB
- Frame Rate
- 30 fps
- Alpha Channel
- No
- Looped
- No
- Video Encoding
- Photo JPEG
- Orientation
- Horizontal
- Commercial License
- Further Information
Description
This animated clip displays a dynamic data visualization of a virus spreading across a map of Germany. Three-dimensional virus particles, reminiscent of coronaviruses, float and pulsate around the edges, framing the central map. Within the blue-outlined map, red circular indicators emerge and expand, simulating infection hotspots or data points spreading across various regions. The background features abstract hexagonal chemical structures and subtle digital glitch effects, enhancing the scientific and technological theme. This visual effect is ideal for enhancing presentations, news broadcasts, or documentaries focused on public health crises, medical research, or scientific data analysis, providing an urgent and informative visual. It effectively communicates complex information about disease propagation in a compelling digital format.