Dynamic 3D Candlestick Chart Animation for Financial Data Visualization
By meshgridOne great value subscription from €14.50/month
- Unlimited downloads of 27+ million creative assets
- AI Tools: video, image and more
- Lifetime commercial license
- Easy cancellation
Already have an account? Sign in
Attributes
- Length
- 0:11
- Resolution
- 1080 x 1920
- File Size
- 11.5 MB
- Frame Rate
- 29.97 fps
- Alpha Channel
- No
- Looped
- No
- Video Encoding
- H.264
- Orientation
- Vertical
- Commercial License
- Further Information
Description
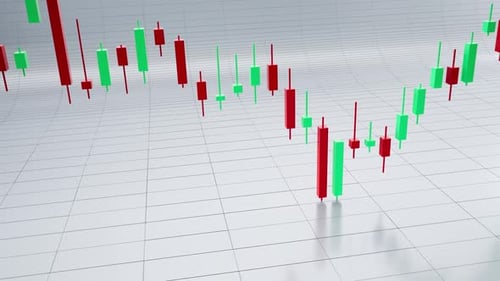
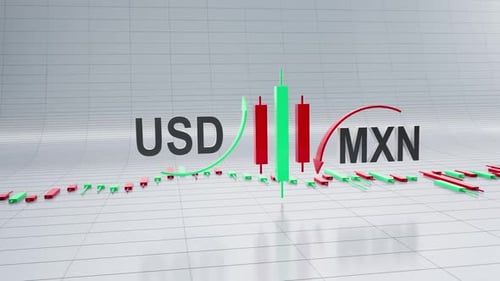
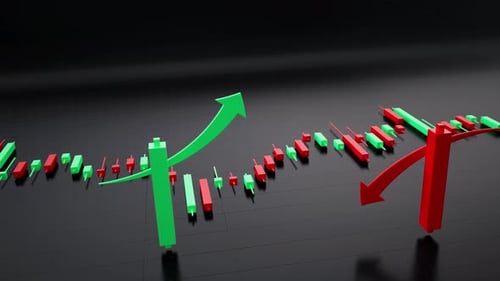
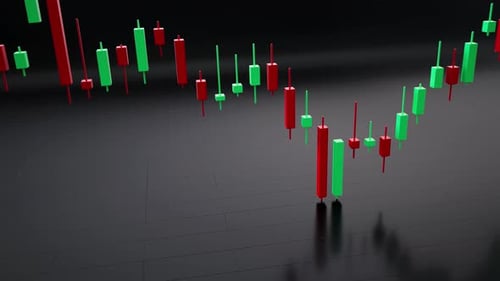
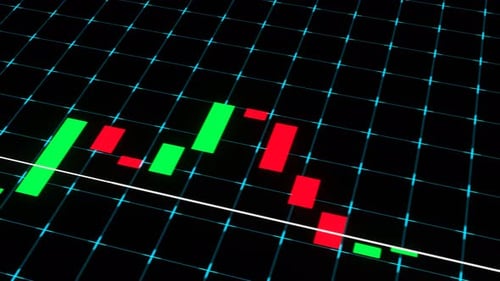
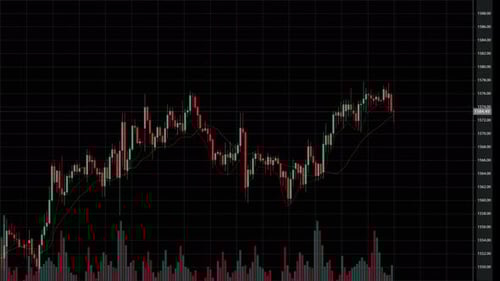
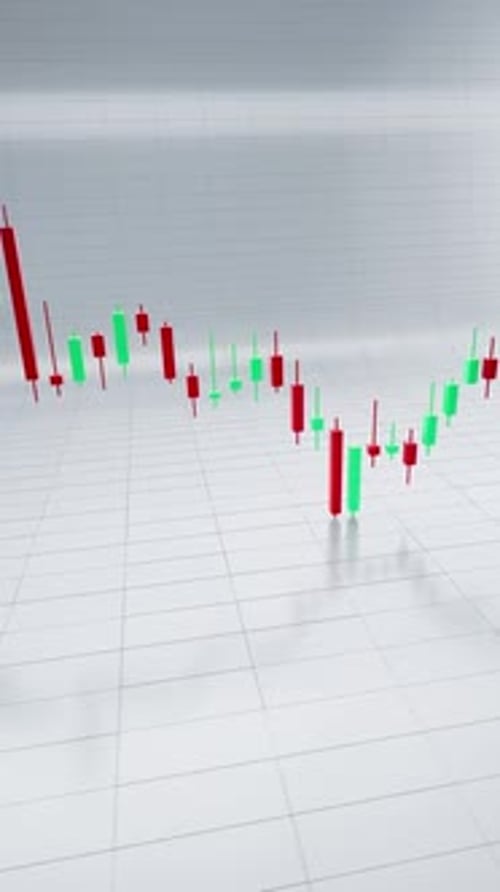
This animated visual features a dynamic 3D candlestick chart, meticulously rendered with glowing red and green bars representing financial data fluctuations. The camera elegantly pans and rotates around the chart, revealing its intricate details and depth against a subtle, gridded white background. This clean and modern motion graphic is ideal for financial reports, market analysis presentations, business news segments, or any project requiring a sophisticated depiction of stock performance and economic trends. Its smooth animation and crisp visuals effectively convey growth, decline, and market volatility, making complex data accessible and engaging for viewers.